
Inhalt
High accuracy for hard wood and early wood decay

The feed force is the force required by the drilling needle to penetrate the wood. Besides the drilling resistance it is the second measured variable of the IML-RESI PowerDrill® and provides additional information about the condition of the wood inside. While the friction at the drilling needle shaft (shaft friction) can strongly influence the drilling resistance, it has only a minimal influence on the feed force. This means that the feed force together with the drilling resistance allows very realistic results to be achieved for the evaluation of the wood.
Display of the feed force as an additional measurement curve

The IML analysis software displays the feed curve together with the drilling resistance curve in a graph. Both curves are color-coded. For a precise evaluation of the measurement results, it is important to interpret both curves in relation to each other and not just one measurement curve in itself.
Without feed curve, shaft friction can hide wood defects
The friction of the shaft becomes greater the further the drilling needle presses into the wood. This influences the drilling resistance curve and causes the curve to rise steadily. The impact of the shaft friction cannot be separated from the actual drilling resistance. Consequently, the measurement curve of the drilling resistance curve remains rising even if the drilling needle penetrates a wood defect, although the drilling resistance decreases.
Measurement of the feed force provides high information value
In certain cases, only a comparison with the feed curve can show how strongly the measured drilling resistance curve is affected by the shaft friction and how large the damage in the wood actually is. This is because the feed curve drops significantly in the case of a wood defect and remains largely unaffected by shaft friction. In this way, especially the wood decay in the early stages becomes visible by the feed curve. Finally, the changes in the drilling resistance at that point in time are still so small that they can easily be covered by the shaft friction in the drilling resistance curve. The measurement of the feed force is also especially advantageous for hard wood species. This is because the shaft friction is higher with hard woods than with soft woods and therefore has a stronger influence.
The additional measurement of the feed force makes it possible, especially with hard woods, to detect wood decay much earlier and more precisely than the drilling resistance measurement alone.
Case studies
The following case studies are intended to illustrate the easy identification of wood decay through the synchronous recording of the drilling resistance and the feed force.
Example 1: Beech with decay
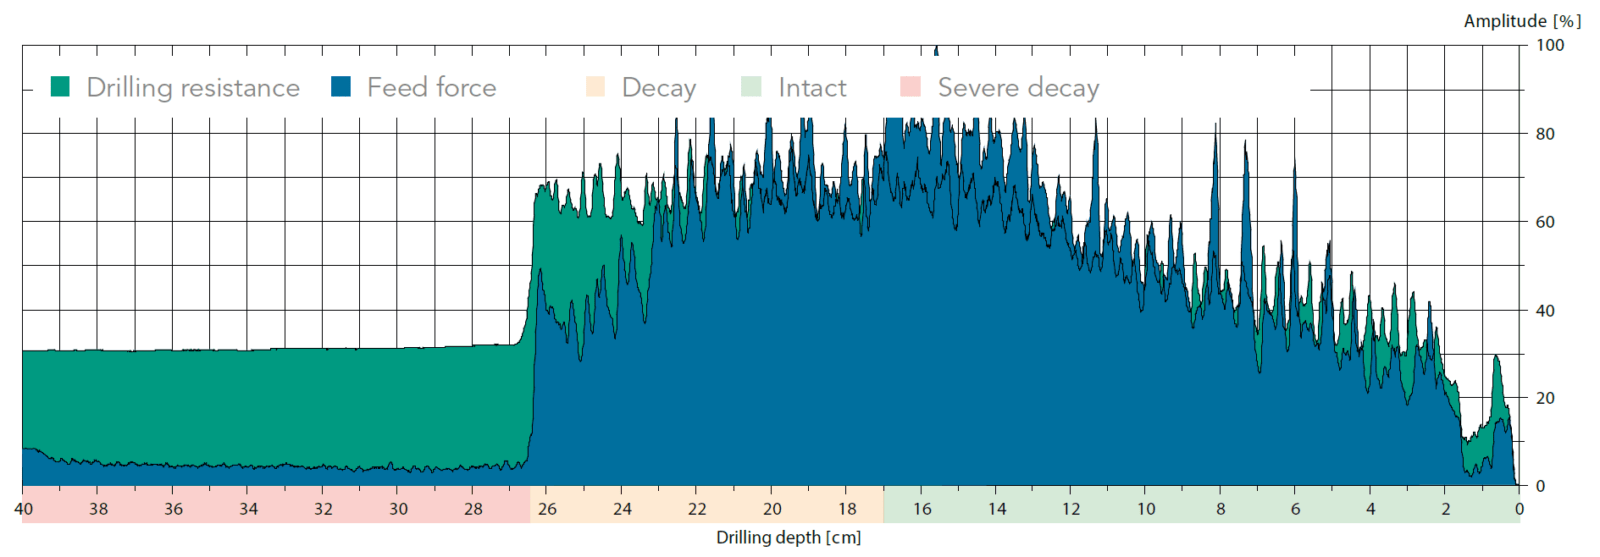
The measurement curve is read from right to left.
The bark can be assigned to the range from 0 to 1.5 cm. From 1.5 to 17 cm, the measurement curves of drilling resistance and feed force increase steadily, indicating the drilling through intact wood. At 17 cm drilling depth, the feed curve drops slightly, which is an indicator of incipient wood decay. Drilling resistance remains constant in this range without an increasing trend. The drop in the feed curve is even more pronounced between 23 and 26.5 cm. From 26.5 cm, the feed resistance almost completely falls back to the initial level. However, due to shaft friction, the drilling resistance remains at around 30% amplitude.
Example 2: Chestnut tree with Kretzschmaria Deusta
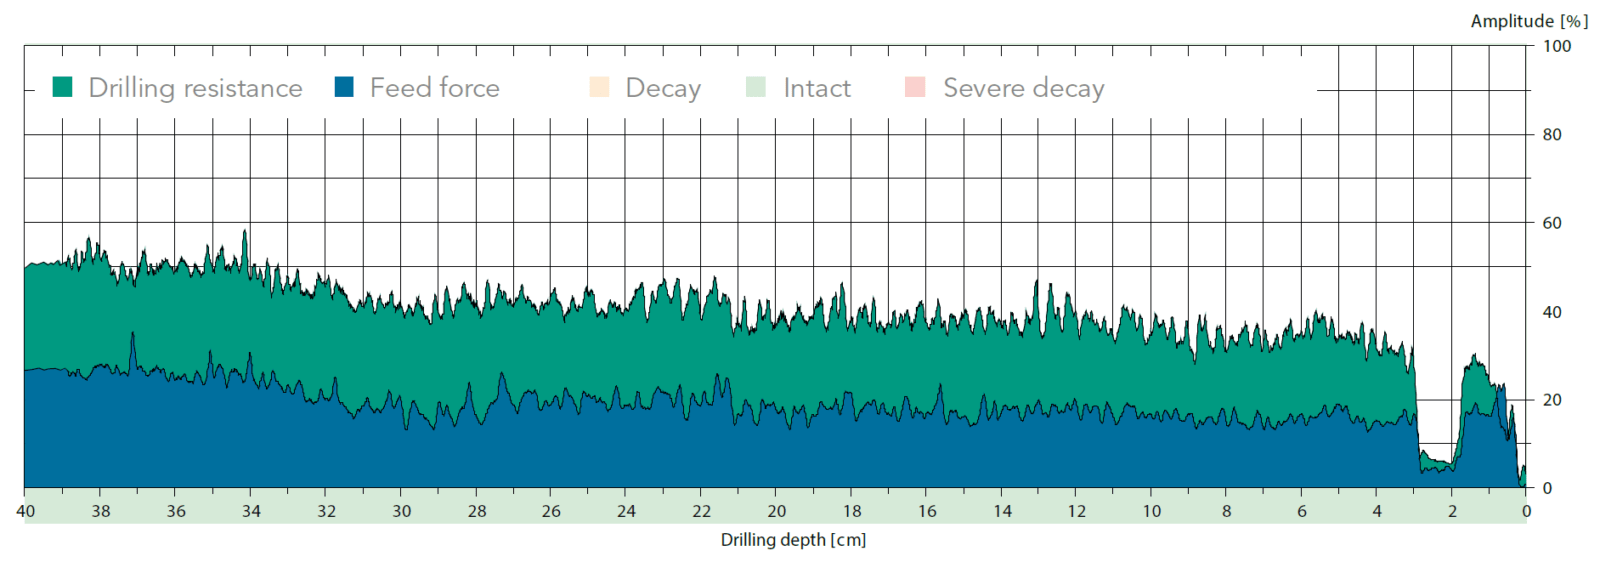
The following example shows two measurements on a chestnut tree with brittle cinder fungus. Visually, the typical black discoloration of the brittle cinder was recognized on the bark, and both a reference measurement in the intact area and a measurement at the base of the trunk were taken. The reference measurement serves to compare the measurement curves and facilitates the identification of defects in the tree. In the example, it can be seen that both the drilling resistance curve and the feed curve have a constant course.
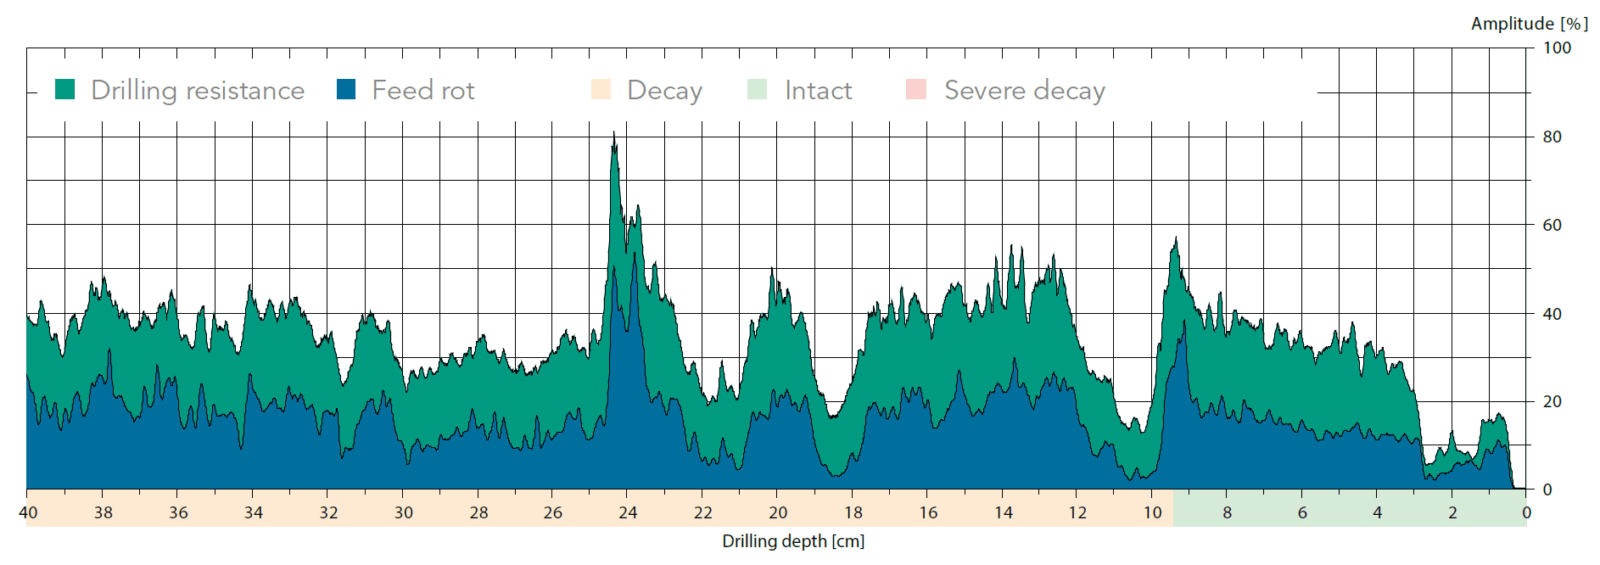
The result of the measurement directly at the base of the stem shows clear differences compared to the reference measurement. From a drilling depth of 9.5 cm onwards, a first significant decrease in both measured values can be observed. A uniform course of the curves is also not visible in the following area, which is typical for wood decay caused by brittle cinder.
Example 3: Timber Inspections
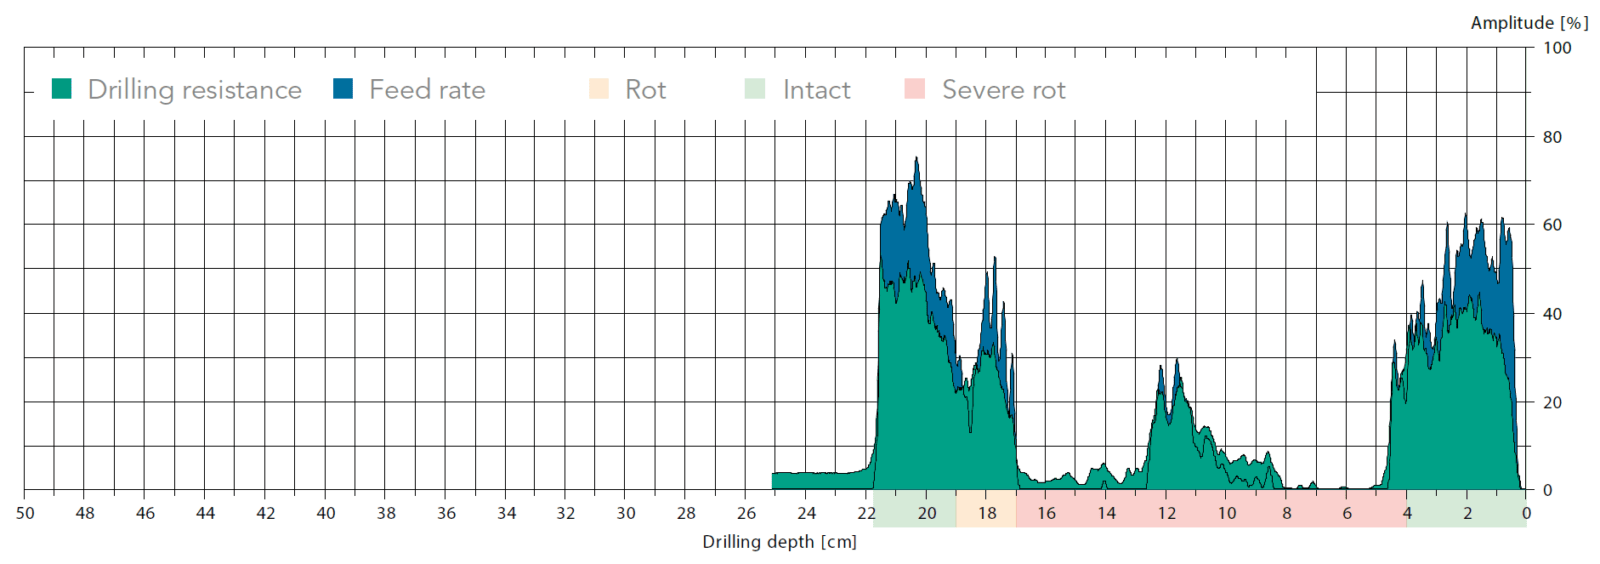
The following example clearly shows the internal defect in both the drill resistance and feed force measurements. To inspect the area directly below ground level, the measurement was performed at a -30° angle at the base of the playground structure. Both measurements show a significant decrease from 4 cm drilling depth, and the damaged area extends to the increase in resistance from 19 cm. The exit of the drill bit from the structure is visible at a depth of 22 cm.
Conclusion
Practical experience on hard tree species has shown that the feed force measurement is only very slightly influenced by shaft friction. Especially for measurements on hard tree species in connection with an early stage of fungus-related wood decay, the feed force curve provides a large amount of information. Feed curve decreases cannot be covered by shaft friction effects as it can be the case with the drilling curve. An interpretation of the drilling resistance measurement result is considerably easier with the feed curve.
Most common areas of application
- The advantage for a wood testing system (previously only a drilling resistance measuring device) of an additional measurement curve should be clear to everyone by now at the latest.
- Tree inspection
- Wood pole inspection
- Construction wood inspection
- Wooden playground equipment inspection
- Truss Inspection
